{kind=image}
{kind=image}
Data Democratization
As data proliferates at an exponential rate, firms are increasingly recognizing the importance of leveraging data to enhance decision-making and creative processes.
The growth of technology has created a significant increase in data, sparking a heightened interest in data-informed decisions within fields like architecture and design, where there hasn’t traditionally been an emphasis. Data is crucial for decision-making in any industry, yet its potential remains untapped if only a limited number of people know how to access and interpret the information. To address this, data democratization has emerged as a leading global trend in the data industry.
So, what exactly is data democratization? This initiative aims to ensure that everyone can access and utilize data to make informed decisions. It involves two primary aspects:
1. Increasing access to data
2. Enhancing data literacy
Both of these elements have a unique application to architects and designers.
In an industry predominantly oriented toward visual thinking and creativity, the concept of data analysis might not seem applicable. During a presentation where data is displayed traditionally as a table, designers will likely find their minds wandering unintentionally since numbers aren’t as intuitive to them as visual elements. Design and data often speak different languages and don't easily talk to one another. However, the results can be profoundly impactful when successfully integrated — design influencing data visualizations and data informing design decisions.
Below is a comparison showing the same information: one version uses numerical data in a table, and the other presents it visually.
{kind=image}
{kind=image}
Increasing access to data in the design world often relies heavily on data visualizations. Translating data into a visual representation helps dismantle the barriers associated with traditional data presentation methods such as tables. Data storytelling also plays an important role by highlighting the meaning behind the numbers. This is where the true value exists and will resonate with project teams as they connect the dots between data, design, and project outcomes. Once data is presented in a user-friendly format, technology plays a critical role in facilitating access to the information.
It’s not enough to simply increase access to data. Individuals must also understand how to interpret and apply these insights effectively in their decision-making processes.
What does data literacy look like in an architecture firm?
The first step is familiarizing staff with the types of data and data sources they encounter daily, often without recognizing them as data. Data extends beyond just numbers and encompasses both quantitative and qualitative elements used by designers on a regular basis.
Some of the best sources for quantitative data are programming documents, which detail the types, quantities, and sizes of spaces. This data is incredibly informative and valuable during client discussions about spatial requirements for different functions.
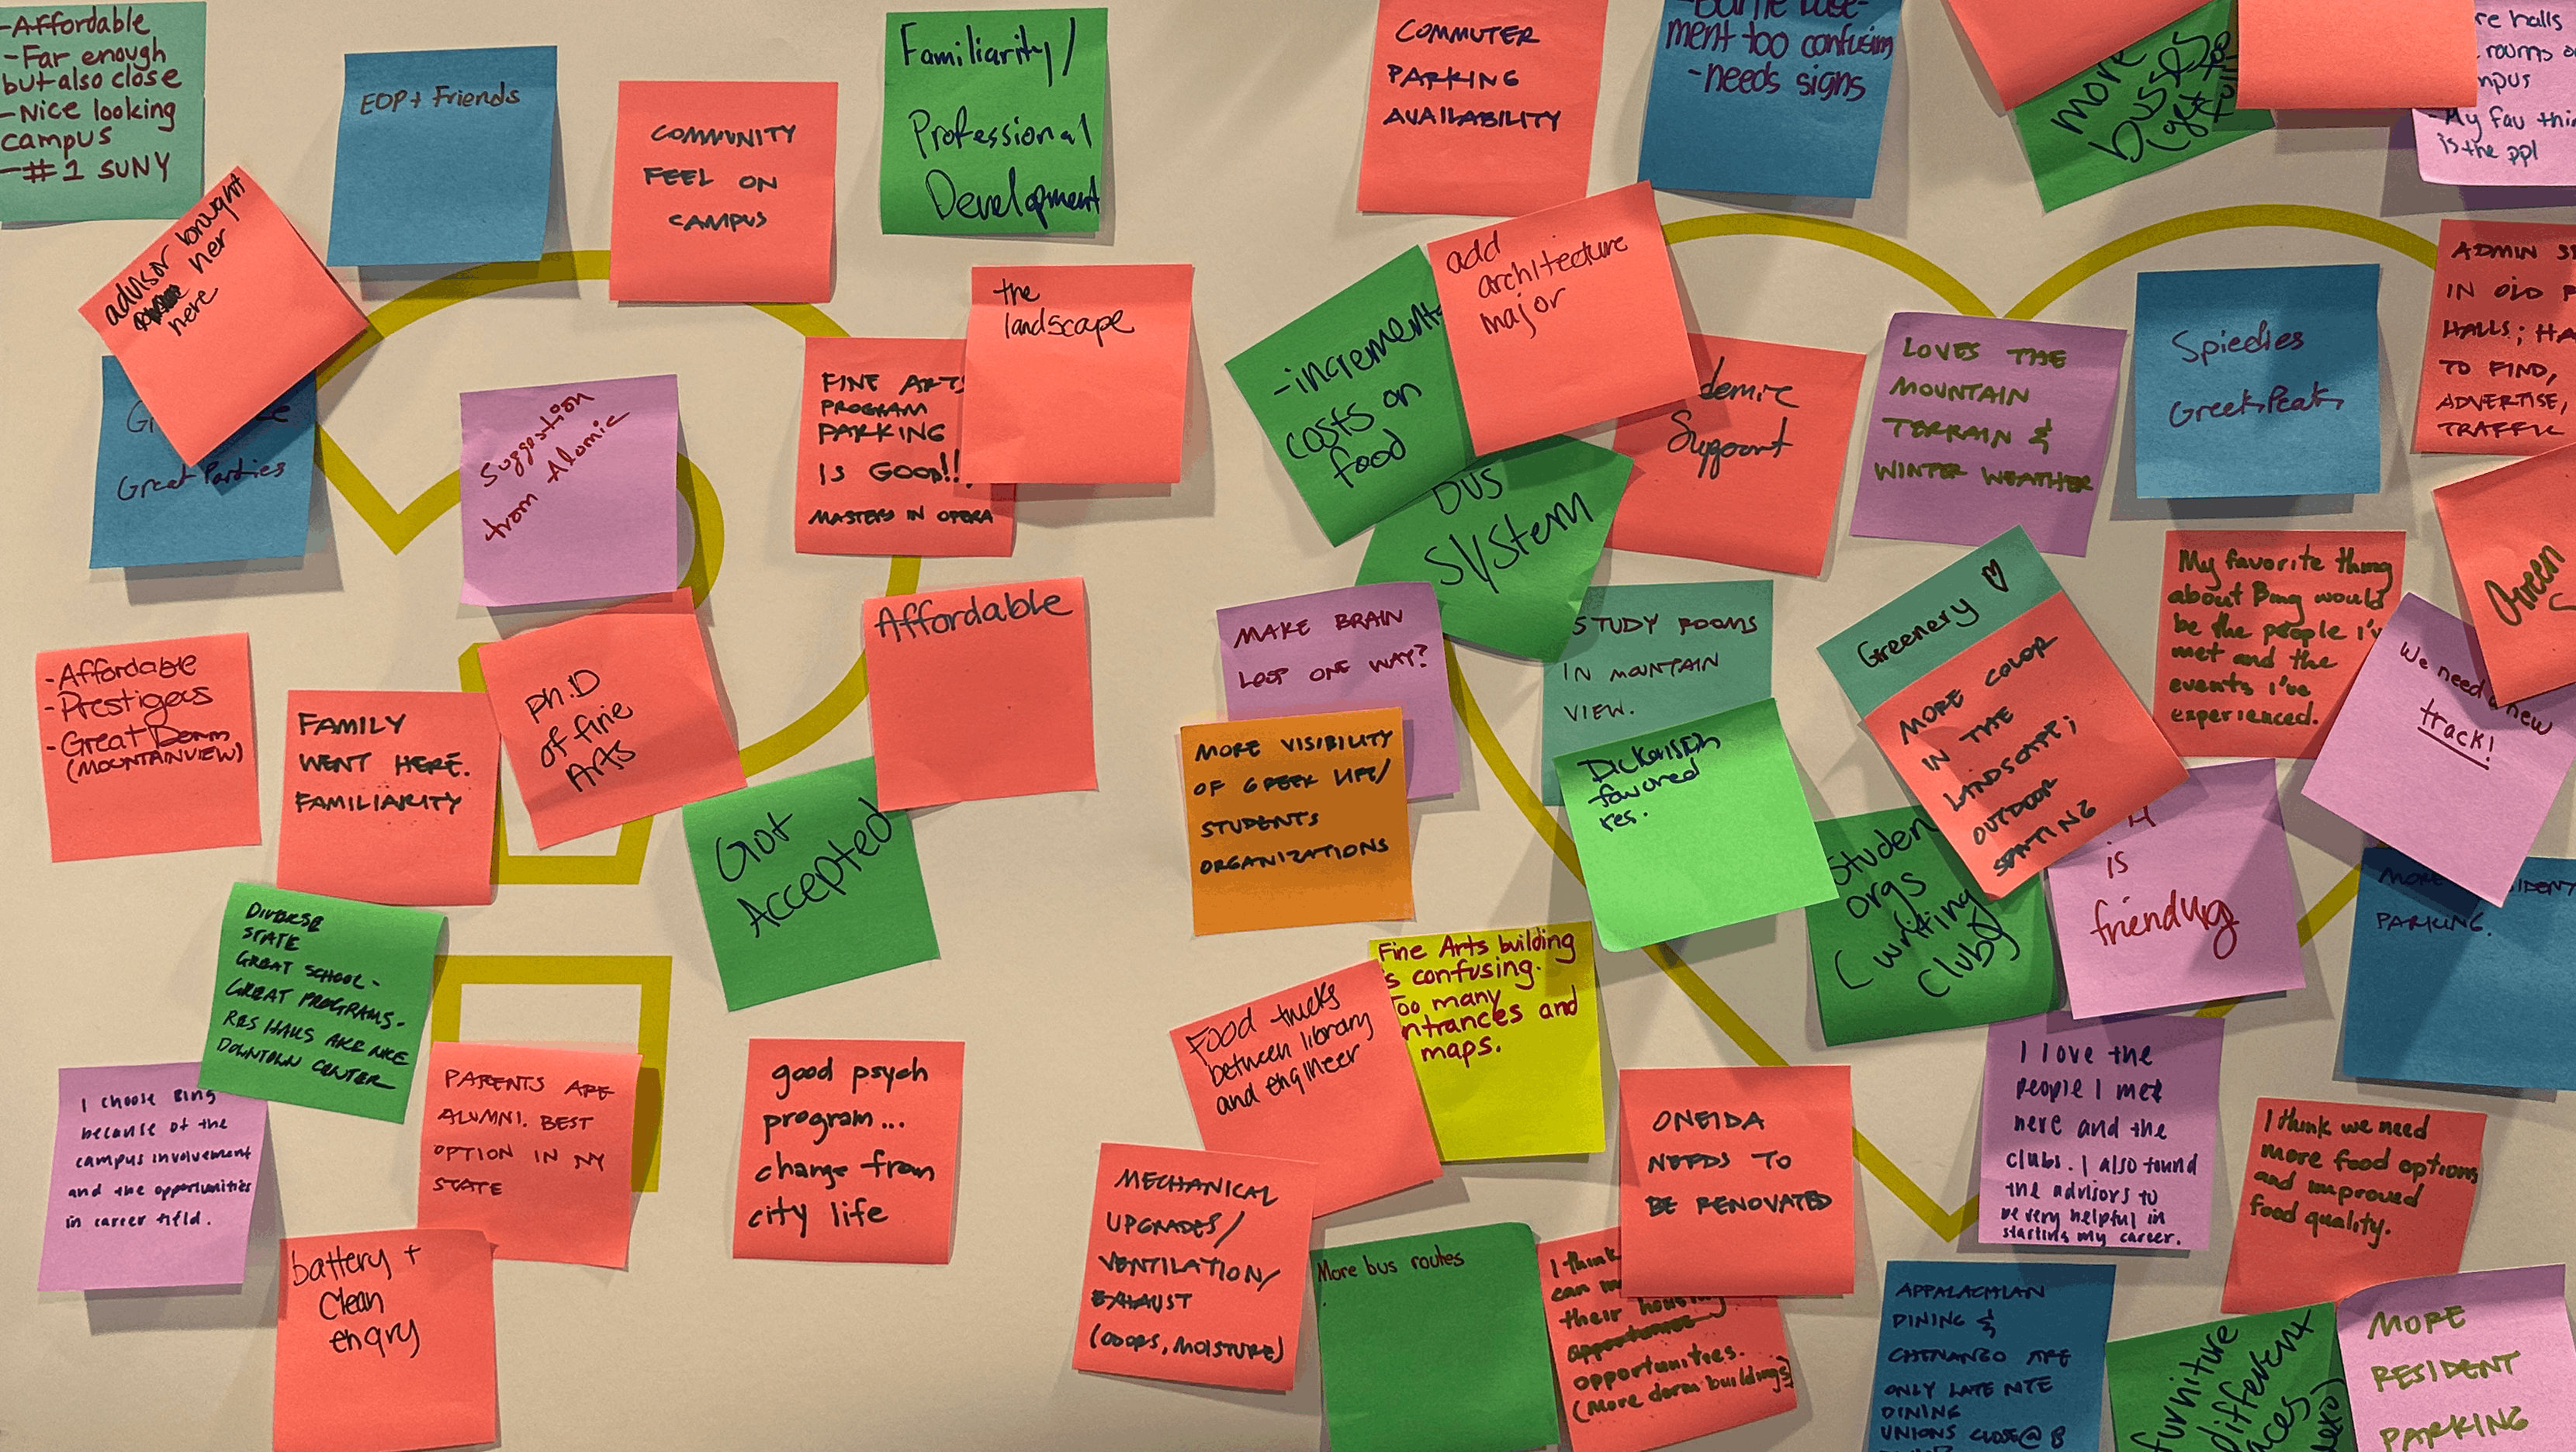
As a firm that focuses on serving our communities, we collect substantial qualitative data. Posters full of sticky-notes from a community engagement event or responses from a questionnaire distributed to students at a university both yield incredibly valuable insights into what matters most to those for whom we are designing. Both of those examples are great sources of qualitative data that our project teams use on a regular basis to inform design decisions.
{kind=image}
{kind=image}
Starting with data types that architects and designers already use in everyday work helps them comfortably transition to more complex data processes. Layering on the data analysis process to data they are already familiar with will isolate the new content, more effectively educating them on how to collect, analyze, and communicate data.
The next step is to expand these practices to additional data sources within the firm. There are endless opportunities for what we could be doing with data that I’m really excited about. As a data analyst, my goal is to help others recognize this potential and integrate data into their projects with a newly instilled confidence in their ability to collect, analyze, interpret, and apply data.
Data democratization is data empowerment. Building designers’ confidence with data analysis will empower them to more consistently integrate it into the design process. Designers and architects are incredibly creative, and weaving in data-informed insights with their creative ideas can yield powerful results.
Data democratization is an ongoing process that will continue to evolve as data and technology advance. The finish line will likely keep moving, but as long as we all keep running, we are heading in the right direction.
Emily Gaines, Business Analyst + Strategist
{kind=image}
{kind=image}
{kind=image}
{kind=image}
{kind=image}
{kind=image}
{kind=image}
{kind=image}
{kind=image}
{kind=image}
{kind=image}
{kind=image}
{kind=image}
{kind=image}
{kind=image}
{kind=image}
{kind=image}
{kind=image}
{kind=image}
{kind=image}
{kind=image}
{kind=image}
{kind=image}
{kind=image}
{kind=image}
{kind=image}
{kind=image}
{kind=image}
{kind=image}
{kind=image}
{kind=image}
{kind=image}
{kind=image}
{kind=image}
{kind=image}
{kind=image}
{kind=image}
{kind=image}
{kind=image}
{kind=image}
{kind=image}
{kind=image}
{kind=image}
{kind=image}
{kind=image}
{kind=image}
{kind=image}
{kind=image}
{kind=image}
{kind=image}
{kind=image}
{kind=image}
{kind=image}
{kind=image}
{kind=image}
{kind=image}
{kind=image}
{kind=image}
{kind=image}
{kind=image}
{kind=image}
{kind=image}
{kind=image}
{kind=image}
{kind=image}
{kind=image}
{kind=image}
{kind=image}
{kind=image}
{kind=image}
{kind=image}
{kind=image}
{kind=image}
{kind=image}
{kind=image}
{kind=image}
{kind=image}
{kind=image}
{kind=image}
{kind=image}
{kind=image}
{kind=image}
{kind=image}
{kind=image}
{kind=image}
{kind=image}
{kind=image}
{kind=image}
{kind=image}
{kind=image}
{kind=image}
{kind=image}
{kind=image}
{kind=image}
{kind=image}
{kind=image}
{kind=image}
{kind=image}
{kind=image}
{kind=image}
{kind=image}
{kind=image}
{kind=image}
{kind=image}
{kind=image}
{kind=image}
{kind=image}
{kind=image}
{kind=image}
{kind=image}
{kind=image}
{kind=image}
{kind=image}
{kind=image}
{kind=image}
{kind=image}
{kind=image}
{kind=image}
{kind=image}
{kind=image}
{kind=image}
{kind=image}
{kind=image}
{kind=image}
{kind=image}
{kind=image}
{kind=image}
{kind=image}
{kind=image}
{kind=image}
{kind=image}
{kind=image}
{kind=image}